 指标监控
指标监控
八、指标监控
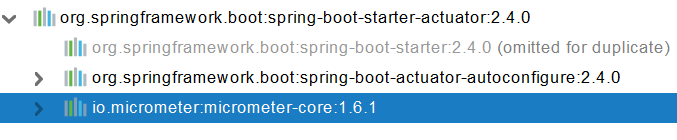
1、SpringBoot Actuator
1、简介
未来每一个微服务在云上部署以后,我们都需要对其进行监控、追踪、审计、控制等。SpringBoot就抽取了Actuator场景,使得我们每个微服务快速引用即可获得生产级别的应用监控、审计等功能。
        <dependency>
            <groupId>org.springframework.boot</groupId>
            <artifactId>spring-boot-starter-actuator</artifactId>
        </dependency>
2
3
4
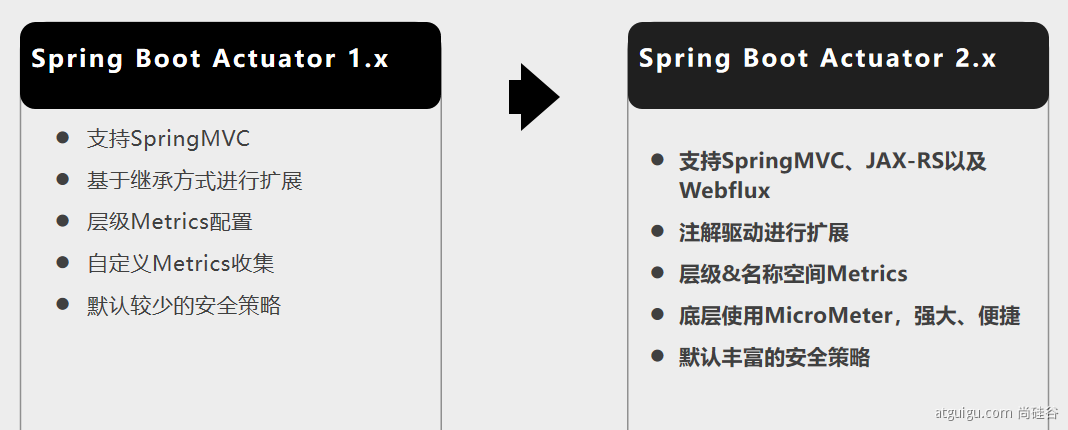
2、1.x与2.x的不同
3、如何使用
- 引入场景
- 访问 http://localhost:8080/actuator/**
- 暴露所有监控信息为HTTP
management:
  endpoints:
    enabled-by-default: true #暴露所有端点信息
    web:
      exposure:
        include: '*'  #以web方式暴露
2
3
4
5
6
- 测试
http://localhost:8080/actuator/beans
http://localhost:8080/actuator/configprops
http://localhost:8080/actuator/metrics
http://localhost:8080/actuator/metrics/jvm.gc.pause
http://localhost:8080/actuator/ (opens new window)endpointName/detailPath 。。。。。。
4、可视化
https://github.com/codecentric/spring-boot-admin
2、Actuator Endpoint
1、最常使用的端点
| ID | 描述 |
|---|---|
auditevents | 暴露当前应用程序的审核事件信息。需要一个AuditEventRepository组件。 |
beans | 显示应用程序中所有Spring Bean的完整列表。 |
caches | 暴露可用的缓存。 |
conditions | 显示自动配置的所有条件信息,包括匹配或不匹配的原因。 |
configprops | 显示所有@ConfigurationProperties。 |
env | 暴露Spring的属性ConfigurableEnvironment |
flyway | 显示已应用的所有Flyway数据库迁移。 需要一个或多个Flyway组件。 |
health | 显示应用程序运行状况信息。 |
httptrace | 显示HTTP跟踪信息(默认情况下,最近100个HTTP请求-响应)。需要一个HttpTraceRepository组件。 |
info | 显示应用程序信息。 |
integrationgraph | 显示Spring integrationgraph 。需要依赖spring-integration-core。 |
loggers | 显示和修改应用程序中日志的配置。 |
liquibase | 显示已应用的所有Liquibase数据库迁移。需要一个或多个Liquibase组件。 |
metrics | 显示当前应用程序的“指标”信息。 |
mappings | 显示所有@RequestMapping路径列表。 |
scheduledtasks | 显示应用程序中的计划任务。 |
sessions | 允许从Spring Session支持的会话存储中检索和删除用户会话。需要使用Spring Session的基于Servlet的Web应用程序。 |
shutdown | 使应用程序正常关闭。默认禁用。 |
startup | 显示由ApplicationStartup收集的启动步骤数据。需要使用SpringApplication进行配置BufferingApplicationStartup。 |
threaddump | 执行线程转储。 |
如果您的应用程序是Web应用程序(Spring MVC,Spring WebFlux或Jersey),则可以使用以下附加端点:
| ID | 描述 |
|---|---|
heapdump | 返回hprof堆转储文件。 |
jolokia | 通过HTTP暴露JMX bean(需要引入Jolokia,不适用于WebFlux)。需要引入依赖jolokia-core。 |
logfile | 返回日志文件的内容(如果已设置logging.file.name或logging.file.path属性)。支持使用HTTPRange标头来检索部分日志文件的内容。 |
prometheus | 以Prometheus服务器可以抓取的格式公开指标。需要依赖micrometer-registry-prometheus。 |
最常用的Endpoint
- Health:监控状况
- Metrics:运行时指标
- Loggers:日志记录
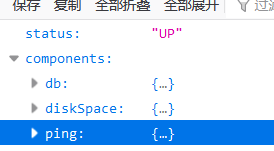
2、Health Endpoint
健康检查端点,我们一般用于在云平台,平台会定时的检查应用的健康状况,我们就需要Health Endpoint可以为平台返回当前应用的一系列组件健康状况的集合。
重要的几点:
- health endpoint返回的结果,应该是一系列健康检查后的一个汇总报告
- 很多的健康检查默认已经自动配置好了,比如:数据库、redis等
- 可以很容易的添加自定义的健康检查机制
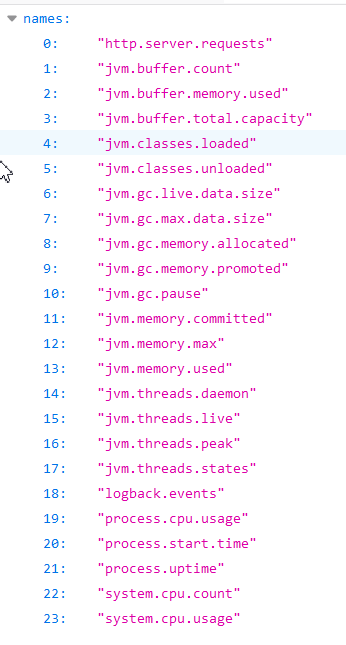
3、Metrics Endpoint
提供详细的、层级的、空间指标信息,这些信息可以被pull(主动推送)或者push(被动获取)方式得到;
- 通过Metrics对接多种监控系统
- 简化核心Metrics开发
- 添加自定义Metrics或者扩展已有Metrics
4、管理Endpoints
1、开启与禁用Endpoints
- 默认所有的Endpoint除过shutdown都是开启的。
- 需要开启或者禁用某个Endpoint。配置模式为 management.endpoint.
.enabled = true
management:
  endpoint:
    beans:
      enabled: true
2
3
4
- 或者禁用所有的Endpoint然后手动开启指定的Endpoint
management:
  endpoints:
    enabled-by-default: false
  endpoint:
    beans:
      enabled: true
    health:
      enabled: true
2
3
4
5
6
7
8
2、暴露Endpoints
支持的暴露方式
- HTTP:默认只暴露health和info Endpoint
- JMX:默认暴露所有Endpoint
- 除过health和info,剩下的Endpoint都应该进行保护访问。如果引入SpringSecurity,则会默认配置安全访问规则
| ID | JMX | Web |
|---|---|---|
auditevents | Yes | No |
beans | Yes | No |
caches | Yes | No |
conditions | Yes | No |
configprops | Yes | No |
env | Yes | No |
flyway | Yes | No |
health | Yes | Yes |
heapdump | N/A | No |
httptrace | Yes | No |
info | Yes | Yes |
integrationgraph | Yes | No |
jolokia | N/A | No |
logfile | N/A | No |
loggers | Yes | No |
liquibase | Yes | No |
metrics | Yes | No |
mappings | Yes | No |
prometheus | N/A | No |
scheduledtasks | Yes | No |
sessions | Yes | No |
shutdown | Yes | No |
startup | Yes | No |
threaddump | Yes | No |
3、定制 Endpoint
1、定制 Health 信息
import org.springframework.boot.actuate.health.Health;
import org.springframework.boot.actuate.health.HealthIndicator;
import org.springframework.stereotype.Component;

@Component
public class MyHealthIndicator implements HealthIndicator {

    @Override
    public Health health() {
        int errorCode = check(); // perform some specific health check
        if (errorCode != 0) {
            return Health.down().withDetail("Error Code", errorCode).build();
        }
        return Health.up().build();
    }

}

构建Health
Health build = Health.down()
                .withDetail("msg", "error service")
                .withDetail("code", "500")
                .withException(new RuntimeException())
                .build();
management:
    health:
      enabled: true
      show-details: always #总是显示详细信息。可显示每个模块的状态信息
2
3
4
5
6
7
8
9
10
11
12
13
14
15
16
17
18
19
20
21
22
23
24
25
26
27
28
@Component
public class MyComHealthIndicator extends AbstractHealthIndicator {

    /**
     * 真实的检查方法
     * @param builder
     * @throws Exception
     */
    @Override
    protected void doHealthCheck(Health.Builder builder) throws Exception {
        //mongodb。  获取连接进行测试
        Map<String,Object> map = new HashMap<>();
        // 检查完成
        if(1 == 2){
//            builder.up(); //健康
            builder.status(Status.UP);
            map.put("count",1);
            map.put("ms",100);
        }else {
//            builder.down();
            builder.status(Status.OUT_OF_SERVICE);
            map.put("err","连接超时");
            map.put("ms",3000);
        }


        builder.withDetail("code",100)
                .withDetails(map);

    }
}
2
3
4
5
6
7
8
9
10
11
12
13
14
15
16
17
18
19
20
21
22
23
24
25
26
27
28
29
30
31
2、定制info信息
常用两种方式
1、编写配置文件
info:
  appName: boot-admin
  version: 2.0.1
  mavenProjectName: @project.artifactId@  #使用@@可以获取maven的pom文件值
  mavenProjectVersion: @project.version@
2
3
4
5
2、编写InfoContributor
import java.util.Collections;

import org.springframework.boot.actuate.info.Info;
import org.springframework.boot.actuate.info.InfoContributor;
import org.springframework.stereotype.Component;

@Component
public class ExampleInfoContributor implements InfoContributor {

    @Override
    public void contribute(Info.Builder builder) {
        builder.withDetail("example",
                Collections.singletonMap("key", "value"));
    }

}
2
3
4
5
6
7
8
9
10
11
12
13
14
15
16
http://localhost:8080/actuator/info 会输出以上方式返回的所有info信息
3、定制Metrics信息
1、SpringBoot支持自动适配的Metrics
JVM metrics, report utilization of:
- Various memory and buffer pools
- Statistics related to garbage collection
- Threads utilization
- Number of classes loaded/unloaded
CPU metrics
File descriptor metrics
Kafka consumer and producer metrics
Log4j2 metrics: record the number of events logged to Log4j2 at each level
Logback metrics: record the number of events logged to Logback at each level
Uptime metrics: report a gauge for uptime and a fixed gauge representing the application’s absolute start time
Tomcat metrics (
server.tomcat.mbeanregistry.enabledmust be set totruefor all Tomcat metrics to be registered)
2、增加定制Metrics
class MyService{
    Counter counter;
    public MyService(MeterRegistry meterRegistry){
         counter = meterRegistry.counter("myservice.method.running.counter");
    }

    public void hello() {
        counter.increment();
    }
}


//也可以使用下面的方式
@Bean
MeterBinder queueSize(Queue queue) {
    return (registry) -> Gauge.builder("queueSize", queue::size).register(registry);
}
2
3
4
5
6
7
8
9
10
11
12
13
14
15
16
17
4、定制Endpoint
@Component
@Endpoint(id = "container")
public class DockerEndpoint {


    @ReadOperation
    public Map getDockerInfo(){
        return Collections.singletonMap("info","docker started...");
    }

    @WriteOperation
    private void restartDocker(){
        System.out.println("docker restarted....");
    }

}
2
3
4
5
6
7
8
9
10
11
12
13
14
15
16
场景:开发ReadinessEndpoint来管理程序是否就绪,或者Liveness****Endpoint来管理程序是否存活;
当然,这个也可以直接使用 https://docs.spring.io/spring-boot/docs/current/reference/html/production-ready-features.html#production-ready-kubernetes-probes